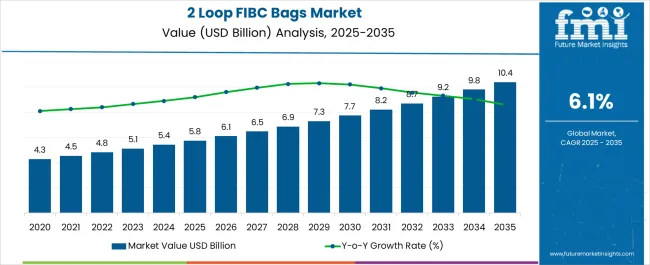
The global 2 loop FIBC bags market size is expected to be valued at USD 2.68 billion in 2023. Investments in infrastructure, bolsters the overall scope for the 2 loop FIBC bags market, which is projected to grow at a CAGR of 3.0% between 2023 and 2033, totaling around USD 3.6 billion by 2033.
Data Points | Key Statistics |
---|---|
2 Loop FIBC Bags Market Value 2023 | USD 2.68 billion |
2 Loop FIBC Bags Market Projected Value (2033) | USD 3.6 billion |
2 Loop FIBC Bags Market CAGR (2023 to 2033) | 3.0% |
The rise in bulk transportation is a significant trend that is driving the increased adoption of 2 loop FIBC (Flexible Intermediate Bulk Container) bags across various industries. The trend is closely tied to the growth of global trade, industrialization, and the need for efficient logistics solutions.
The global economy is increasingly interconnected, and trade volumes are consistently on the rise. There is a growing demand for packaging solutions that can efficiently transport large quantities of goods, as businesses engage in cross-border trade and international supply chains. 2 Loop FIBC bags provide a versatile and reliable option for bulk shipments, accommodating a wide range of materials and products.
In industries where materials are produced or extracted in bulk, efficient storage and handling are paramount. 2 Loop FIBC bags offer a space-saving and organized method of storing and transporting large quantities of materials. Their high capacity allows for significant amounts of goods to be moved in a single shipment, reducing the need for multiple smaller containers.
Bulk transportation using 2 Loop FIBC bags can result in cost savings compared to traditional packaging methods. The bags eliminate the need for excessive smaller containers, reducing handling and storage costs. Their lightweight design means they contribute minimally to the overall weight of the shipment, which can result in reduced transportation expenses.
The global demand for 2 loop FIBC bags increased at a CAGR of 2.0% during the forecast period between 2018 and 2022, reaching a total of USD 3.6 billion in 2033. According to Future Market Insights, a market research and competitive intelligence provider, the 2 loop FIBC bags market was valued at USD 2.6 billion in 2022.
The rise of e-commerce and online retail has significantly transformed the way products are bought and sold, leading to a surge in demand for efficient and reliable packaging solutions for bulk products. 2 Loop FIBC bags have emerged as a valuable solution in the e-commerce and logistics sectors due to their ability to address the unique challenges of these industries.
In the e-commerce landscape, efficient utilization of warehouse space is crucial. 2 Loop FIBC bags offer a space-efficient packaging solution that allows for better stacking and storage compared to individual or smaller packages. The efficiency enables warehouses to maximize their storage capacity and better organize products, facilitating streamlined order fulfillment processes.
E-commerce platforms often deal with bulk orders or large quantities of products that need to be transported from distribution centers to end customers. 2 Loop FIBC bags provide a convenient way to package and transport bulk items, reducing the need for excessive packaging materials and minimizing the number of shipments required.
Ensuring that products remain secure and intact during transit is a critical concern in e-commerce and logistics. 2 Loop FIBC bags are designed with reinforced loops that enable easy lifting and handling using machinery, while the bag's sturdy construction helps protect the contents from damage, moisture, and contamination during transportation.
Advanced Manufacturing Technologies is Likely to be Beneficial for Market Growth
Advanced manufacturing technologies are playing a crucial role in revolutionizing the production and design of 2 Loop FIBC bags. The innovations are driving the development of bags that offer superior strength, durability, and operational efficiency, addressing the evolving needs of various industries.
Traditional sewing methods used in bag construction have given way to more advanced stitching techniques. High-quality stitching, often utilizing computer-controlled sewing machines, ensures that seams are tightly sealed and resistant to stress and load. The technology enhances the overall structural integrity of the bags, making them capable of withstanding heavy loads without seam failure.
Advanced heat-sealing and welding technologies are increasingly being employed to create strong and secure seams in 2 Loop FIBC bags. The techniques involve the fusion of bag materials using heat and pressure, resulting in leak-proof and durable seams that can withstand rigorous handling and transportation.
Advanced manufacturing has paved the way for the use of innovative materials in 2 Loop FIBC bag production. High-strength woven fabrics, coated materials, and laminates are being employed to enhance the bags' resistance to abrasion, tearing, and puncture. The materials contribute to the overall ruggedness and longevity of the bags.
Global Trade Expansion to Fuel the Market Growth
Global trade expansion has led to an increased demand for packaging solutions that can effectively and efficiently transport bulk goods across borders and regions. In this context, 2 Loop FIBC bags have emerged as a versatile and standardized packaging option that aligns well with the demands of international trade.
One of the key advantages of 2 Loop FIBC bags is their standardized design and dimensions. The uniformity ensures consistency in packaging and handling procedures, making it easier for manufacturers, exporters, and importers to manage and transport goods across different countries and supply chains. The standardized nature of these bags simplifies logistics and reduces potential complications that could arise from varying packaging methods.
Global trade often involves large volumes of goods being transported over long distances. 2 Loop FIBC bags offer a cost-efficient solution for bulk packaging, as they can hold substantial quantities of materials while minimizing the need for excess packaging or containers, which reduces transportation costs, optimizes container space, and contributes to overall cost savings in the supply chain.
The nature of international trade exposes goods to a range of environmental conditions during transportation, including humidity, temperature fluctuations, and exposure to the elements. 2 Loop FIBC bags are designed to withstand such conditions, providing a protective barrier that helps preserve the quality and integrity of the packaged goods. The protective feature is particularly crucial for goods that are sensitive to moisture or other environmental factors.
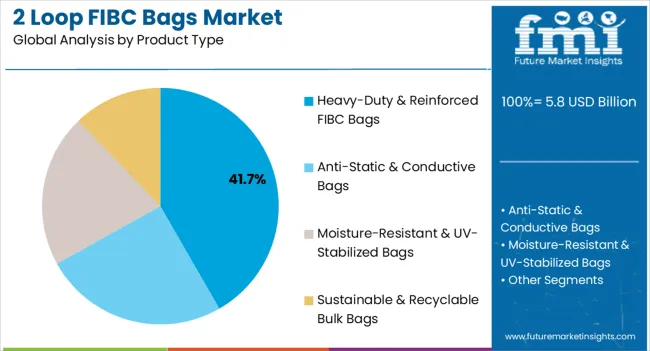
By packaging type, bottles segment is estimated to be the leading segment at a CAGR of 2.9% during the forecast period. Bottles are commonly used to package liquids and semi-liquids, including beverages, chemicals, pharmaceuticals, and industrial fluids. The products often need to be transported and stored in bulk quantities, and 2 Loop FIBC bags provide an efficient and secure solution for handling large volumes of bottled liquids. The bags can accommodate multiple bottles, providing a safe and organized way to transport and store bottled products.
Bottles, especially glass ones, are susceptible to breakage during transportation and handling. 2 Loop FIBC bags offer a protective layer that reduces the risk of bottle breakage due to impacts or vibrations during transit. The bags' sturdy construction and cushioning properties help safeguard bottled products, minimizing losses and ensuring product integrity.
Bottled liquids are often transported in crates or cartons, which can be bulky and require additional packaging materials. 2 Loop FIBC bags offer a space-efficient alternative, allowing more bottles to be transported in a single bag. The efficient use of space can lead to cost savings in terms of transportation, handling, and storage.
2 Loop FIBC bags are versatile and can accommodate various sizes and shapes of bottles. The adaptability is advantageous for businesses that deal with different bottle dimensions or types of liquids. The bags can be customized to fit the specific requirements of different bottled products, making them a flexible packaging solution.
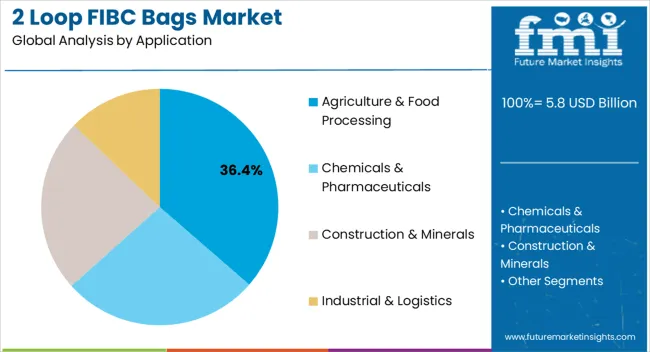
By application, the pharmaceuticals segment is estimated to be the leading segment at a CAGR of 2.9% during the forecast period. Pharmaceuticals are sensitive products that require stringent handling and protection to ensure their quality and integrity. 2 Loop FIBC bags offer a secure and contamination-free packaging solution for transporting pharmaceuticals in bulk quantities. The bags' design prevents external contaminants from entering and maintains a controlled environment, safeguarding the efficacy of pharmaceutical products.
The pharmaceutical industry is subject to strict regulatory guidelines regarding packaging and transportation. 2 Loop FIBC bags can be customized to meet regulatory requirements, such as tamper-evident closures, labels, and documentation pockets, which ensures that pharmaceuticals are transported in compliance with regulatory standards, reducing the risk of legal and quality-related issues.
Pharmaceuticals often need to be transported between manufacturing facilities, distribution centers, and pharmacies or healthcare institutions. 2 Loop FIBC bags provide an efficient method for handling and distributing pharmaceutical products. They can be easily loaded onto pallets or transport vehicles and offer a standardized packaging solution that simplifies logistics processes.
Pharmaceuticals can be sensitive to environmental factors such as moisture, light, and temperature fluctuations. 2 Loop FIBC bags can be designed with specialized materials, such as moisture-resistant or UV-protective coatings, to provide enhanced protection against these factors, which helps maintain the stability and shelf life of pharmaceutical products.
The rapid growth of e-commerce and online retail in North America has led to increased demand for efficient and cost-effective packaging solutions for bulk goods. 2 Loop FIBC bags offer a practical solution for transporting a wide range of products, including industrial materials, agricultural products, and consumer goods, in a secure and organized manner.
North America is a hub for various industrial and manufacturing activities, including chemicals, construction, and agriculture. 2 Loop FIBC bags are widely used to transport raw materials, ingredients, and finished products within these industries. The bags' durability and capacity make them suitable for bulk handling, contributing to their increased adoption.
The agricultural industry in North America relies heavily on efficient packaging and transportation solutions for crops, seeds, and fertilizers. The bags provide a convenient way to store, transport, and distribute agricultural products, helping to streamline supply chain processes and minimize handling.
The growing emphasis on sustainability and waste reduction has led to increased demand for packaging solutions that support recycling and waste management. The bags are often used to transport recyclable materials, such as plastic, paper, and metal, contributing to efficient waste collection and recycling efforts. The region is expected to hold a CAGR of 2.9% over the analysis period.
Asia Pacific is known for its robust industrial and manufacturing sectors, which require efficient packaging solutions for the transportation of raw materials, intermediate products, and finished goods. 2 Loop FIBC bags provide a cost-effective and convenient means of handling and transporting bulk materials, contributing to the growth of the market.
The region's extensive agricultural activities, including crop cultivation and agribusiness, create a strong demand for packaging solutions for products such as grains, seeds, fertilizers, and agricultural produce. The bags offer a reliable method of packaging and transporting these goods, supporting efficient supply chain operations.
Rapid urbanization and infrastructure development projects in Asia Pacific require the transportation of construction materials, aggregates, and cement. The bags are well-suited for the bulk transportation of these materials, contributing to the growth of the construction sector and the demand for these bags.
The burgeoning e-commerce market in Asia Pacific has led to an increased need for efficient and secure packaging solutions for bulk products. 2 Loop FIBC bags are adopted for their ability to optimize warehousing, handling, and transportation processes, meeting the logistics demands of the e-commerce supply chain. The region is expected to hold a CAGR of 2.8% over the analysis period.
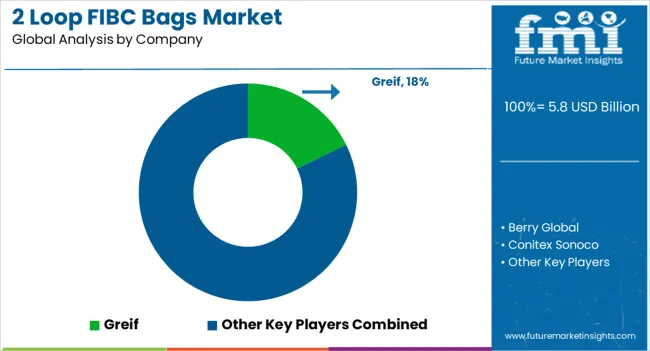
Key players in the 2-loop FIBC bags market are strongly focusing on profit generation from their existing product portfolios along while exploring potential new applications.
The players are emphasizing on increasing their 2 loop FIBC bags production capacities, to cater to the demand from numerous end use industries. Prominent players are also pushing for geographical expansion to decrease the dependency on imported 2 loop FIBC bags.
Recent Developments:
Attributes | Details |
---|---|
Forecast Period | 2023 to 2033 |
Historical Data Available for | 2018 to 2022 |
Expected Value in 2023 | USD 2.68 billion |
Projected Value in 2033 | USD 3.6 billion |
Growth Rate | CAGR of 3% from 2023 to 2033 |
Market Analysis | USD billion for value and Tons for Volume |
Key Regions Covered | North America; Latin America; Western Europe; Eastern Europe; South Asia & Pacific; East Asia; Middle East & Africa |
Key Countries Covered | United States, Canada, Brazil, Mexico, Germany, United Kingdom, France, Spain, Italy, Poland, Russia, Czech Republic, Romania, India, Bangladesh, Australia, New Zealand, China, Japan, South Korea, GCC Countries, South Africa, Israel |
Key Segments Covered | Size, Packaging Type, Application, Region |
Key Companies Profiled | Greif; Chuangda Group; Rockleigh Industries; Propex Operating Company LLC; CHK Manufacturing Inc.; Delta Big Bag, LARE FIBC LLC; Rosenflex UK Ltd.; CHK Manufacturing Inc.; Bulk Corp International; TechnoPac GmbH |
Customization & Pricing | Available upon Request |
Table 1: Global Market Value (US$ Million) Forecast by Region, 2018 to 2033
Table 2: Global Market Volume (Units) Forecast by Region, 2018 to 2033
Table 3: Global Market Value (US$ Million) Forecast by Size, 2018 to 2033
Table 4: Global Market Volume (Units) Forecast by Size, 2018 to 2033
Table 5: Global Market Value (US$ Million) Forecast by Packaging Type, 2018 to 2033
Table 6: Global Market Volume (Units) Forecast by Packaging Type, 2018 to 2033
Table 7: Global Market Value (US$ Million) Forecast by Application, 2018 to 2033
Table 8: Global Market Volume (Units) Forecast by Application, 2018 to 2033
Table 9: North America Market Value (US$ Million) Forecast by Country, 2018 to 2033
Table 10: North America Market Volume (Units) Forecast by Country, 2018 to 2033
Table 11: North America Market Value (US$ Million) Forecast by Size, 2018 to 2033
Table 12: North America Market Volume (Units) Forecast by Size, 2018 to 2033
Table 13: North America Market Value (US$ Million) Forecast by Packaging Type, 2018 to 2033
Table 14: North America Market Volume (Units) Forecast by Packaging Type, 2018 to 2033
Table 15: North America Market Value (US$ Million) Forecast by Application, 2018 to 2033
Table 16: North America Market Volume (Units) Forecast by Application, 2018 to 2033
Table 17: Latin America Market Value (US$ Million) Forecast by Country, 2018 to 2033
Table 18: Latin America Market Volume (Units) Forecast by Country, 2018 to 2033
Table 19: Latin America Market Value (US$ Million) Forecast by Size, 2018 to 2033
Table 20: Latin America Market Volume (Units) Forecast by Size, 2018 to 2033
Table 21: Latin America Market Value (US$ Million) Forecast by Packaging Type, 2018 to 2033
Table 22: Latin America Market Volume (Units) Forecast by Packaging Type, 2018 to 2033
Table 23: Latin America Market Value (US$ Million) Forecast by Application, 2018 to 2033
Table 24: Latin America Market Volume (Units) Forecast by Application, 2018 to 2033
Table 25: Western Europe Market Value (US$ Million) Forecast by Country, 2018 to 2033
Table 26: Western Europe Market Volume (Units) Forecast by Country, 2018 to 2033
Table 27: Western Europe Market Value (US$ Million) Forecast by Size, 2018 to 2033
Table 28: Western Europe Market Volume (Units) Forecast by Size, 2018 to 2033
Table 29: Western Europe Market Value (US$ Million) Forecast by Packaging Type, 2018 to 2033
Table 30: Western Europe Market Volume (Units) Forecast by Packaging Type, 2018 to 2033
Table 31: Western Europe Market Value (US$ Million) Forecast by Application, 2018 to 2033
Table 32: Western Europe Market Volume (Units) Forecast by Application, 2018 to 2033
Table 33: Eastern Europe Market Value (US$ Million) Forecast by Country, 2018 to 2033
Table 34: Eastern Europe Market Volume (Units) Forecast by Country, 2018 to 2033
Table 35: Eastern Europe Market Value (US$ Million) Forecast by Size, 2018 to 2033
Table 36: Eastern Europe Market Volume (Units) Forecast by Size, 2018 to 2033
Table 37: Eastern Europe Market Value (US$ Million) Forecast by Packaging Type, 2018 to 2033
Table 38: Eastern Europe Market Volume (Units) Forecast by Packaging Type, 2018 to 2033
Table 39: Eastern Europe Market Value (US$ Million) Forecast by Application, 2018 to 2033
Table 40: Eastern Europe Market Volume (Units) Forecast by Application, 2018 to 2033
Table 41: South Asia and Pacific Market Value (US$ Million) Forecast by Country, 2018 to 2033
Table 42: South Asia and Pacific Market Volume (Units) Forecast by Country, 2018 to 2033
Table 43: South Asia and Pacific Market Value (US$ Million) Forecast by Size, 2018 to 2033
Table 44: South Asia and Pacific Market Volume (Units) Forecast by Size, 2018 to 2033
Table 45: South Asia and Pacific Market Value (US$ Million) Forecast by Packaging Type, 2018 to 2033
Table 46: South Asia and Pacific Market Volume (Units) Forecast by Packaging Type, 2018 to 2033
Table 47: South Asia and Pacific Market Value (US$ Million) Forecast by Application, 2018 to 2033
Table 48: South Asia and Pacific Market Volume (Units) Forecast by Application, 2018 to 2033
Table 49: East Asia Market Value (US$ Million) Forecast by Country, 2018 to 2033
Table 50: East Asia Market Volume (Units) Forecast by Country, 2018 to 2033
Table 51: East Asia Market Value (US$ Million) Forecast by Size, 2018 to 2033
Table 52: East Asia Market Volume (Units) Forecast by Size, 2018 to 2033
Table 53: East Asia Market Value (US$ Million) Forecast by Packaging Type, 2018 to 2033
Table 54: East Asia Market Volume (Units) Forecast by Packaging Type, 2018 to 2033
Table 55: East Asia Market Value (US$ Million) Forecast by Application, 2018 to 2033
Table 56: East Asia Market Volume (Units) Forecast by Application, 2018 to 2033
Table 57: Middle East and Africa Market Value (US$ Million) Forecast by Country, 2018 to 2033
Table 58: Middle East and Africa Market Volume (Units) Forecast by Country, 2018 to 2033
Table 59: Middle East and Africa Market Value (US$ Million) Forecast by Size, 2018 to 2033
Table 60: Middle East and Africa Market Volume (Units) Forecast by Size, 2018 to 2033
Table 61: Middle East and Africa Market Value (US$ Million) Forecast by Packaging Type, 2018 to 2033
Table 62: Middle East and Africa Market Volume (Units) Forecast by Packaging Type, 2018 to 2033
Table 63: Middle East and Africa Market Value (US$ Million) Forecast by Application, 2018 to 2033
Table 64: Middle East and Africa Market Volume (Units) Forecast by Application, 2018 to 2033
Figure 1: Global Market Value (US$ Million) by Size, 2023 to 2033
Figure 2: Global Market Value (US$ Million) by Packaging Type, 2023 to 2033
Figure 3: Global Market Value (US$ Million) by Application, 2023 to 2033
Figure 4: Global Market Value (US$ Million) by Region, 2023 to 2033
Figure 5: Global Market Value (US$ Million) Analysis by Region, 2018 to 2033
Figure 6: Global Market Volume (Units) Analysis by Region, 2018 to 2033
Figure 7: Global Market Value Share (%) and BPS Analysis by Region, 2023 to 2033
Figure 8: Global Market Y-o-Y Growth (%) Projections by Region, 2023 to 2033
Figure 9: Global Market Value (US$ Million) Analysis by Size, 2018 to 2033
Figure 10: Global Market Volume (Units) Analysis by Size, 2018 to 2033
Figure 11: Global Market Value Share (%) and BPS Analysis by Size, 2023 to 2033
Figure 12: Global Market Y-o-Y Growth (%) Projections by Size, 2023 to 2033
Figure 13: Global Market Value (US$ Million) Analysis by Packaging Type, 2018 to 2033
Figure 14: Global Market Volume (Units) Analysis by Packaging Type, 2018 to 2033
Figure 15: Global Market Value Share (%) and BPS Analysis by Packaging Type, 2023 to 2033
Figure 16: Global Market Y-o-Y Growth (%) Projections by Packaging Type, 2023 to 2033
Figure 17: Global Market Value (US$ Million) Analysis by Application, 2018 to 2033
Figure 18: Global Market Volume (Units) Analysis by Application, 2018 to 2033
Figure 19: Global Market Value Share (%) and BPS Analysis by Application, 2023 to 2033
Figure 20: Global Market Y-o-Y Growth (%) Projections by Application, 2023 to 2033
Figure 21: Global Market Attractiveness by Size, 2023 to 2033
Figure 22: Global Market Attractiveness by Packaging Type, 2023 to 2033
Figure 23: Global Market Attractiveness by Application, 2023 to 2033
Figure 24: Global Market Attractiveness by Region, 2023 to 2033
Figure 25: North America Market Value (US$ Million) by Size, 2023 to 2033
Figure 26: North America Market Value (US$ Million) by Packaging Type, 2023 to 2033
Figure 27: North America Market Value (US$ Million) by Application, 2023 to 2033
Figure 28: North America Market Value (US$ Million) by Country, 2023 to 2033
Figure 29: North America Market Value (US$ Million) Analysis by Country, 2018 to 2033
Figure 30: North America Market Volume (Units) Analysis by Country, 2018 to 2033
Figure 31: North America Market Value Share (%) and BPS Analysis by Country, 2023 to 2033
Figure 32: North America Market Y-o-Y Growth (%) Projections by Country, 2023 to 2033
Figure 33: North America Market Value (US$ Million) Analysis by Size, 2018 to 2033
Figure 34: North America Market Volume (Units) Analysis by Size, 2018 to 2033
Figure 35: North America Market Value Share (%) and BPS Analysis by Size, 2023 to 2033
Figure 36: North America Market Y-o-Y Growth (%) Projections by Size, 2023 to 2033
Figure 37: North America Market Value (US$ Million) Analysis by Packaging Type, 2018 to 2033
Figure 38: North America Market Volume (Units) Analysis by Packaging Type, 2018 to 2033
Figure 39: North America Market Value Share (%) and BPS Analysis by Packaging Type, 2023 to 2033
Figure 40: North America Market Y-o-Y Growth (%) Projections by Packaging Type, 2023 to 2033
Figure 41: North America Market Value (US$ Million) Analysis by Application, 2018 to 2033
Figure 42: North America Market Volume (Units) Analysis by Application, 2018 to 2033
Figure 43: North America Market Value Share (%) and BPS Analysis by Application, 2023 to 2033
Figure 44: North America Market Y-o-Y Growth (%) Projections by Application, 2023 to 2033
Figure 45: North America Market Attractiveness by Size, 2023 to 2033
Figure 46: North America Market Attractiveness by Packaging Type, 2023 to 2033
Figure 47: North America Market Attractiveness by Application, 2023 to 2033
Figure 48: North America Market Attractiveness by Country, 2023 to 2033
Figure 49: Latin America Market Value (US$ Million) by Size, 2023 to 2033
Figure 50: Latin America Market Value (US$ Million) by Packaging Type, 2023 to 2033
Figure 51: Latin America Market Value (US$ Million) by Application, 2023 to 2033
Figure 52: Latin America Market Value (US$ Million) by Country, 2023 to 2033
Figure 53: Latin America Market Value (US$ Million) Analysis by Country, 2018 to 2033
Figure 54: Latin America Market Volume (Units) Analysis by Country, 2018 to 2033
Figure 55: Latin America Market Value Share (%) and BPS Analysis by Country, 2023 to 2033
Figure 56: Latin America Market Y-o-Y Growth (%) Projections by Country, 2023 to 2033
Figure 57: Latin America Market Value (US$ Million) Analysis by Size, 2018 to 2033
Figure 58: Latin America Market Volume (Units) Analysis by Size, 2018 to 2033
Figure 59: Latin America Market Value Share (%) and BPS Analysis by Size, 2023 to 2033
Figure 60: Latin America Market Y-o-Y Growth (%) Projections by Size, 2023 to 2033
Figure 61: Latin America Market Value (US$ Million) Analysis by Packaging Type, 2018 to 2033
Figure 62: Latin America Market Volume (Units) Analysis by Packaging Type, 2018 to 2033
Figure 63: Latin America Market Value Share (%) and BPS Analysis by Packaging Type, 2023 to 2033
Figure 64: Latin America Market Y-o-Y Growth (%) Projections by Packaging Type, 2023 to 2033
Figure 65: Latin America Market Value (US$ Million) Analysis by Application, 2018 to 2033
Figure 66: Latin America Market Volume (Units) Analysis by Application, 2018 to 2033
Figure 67: Latin America Market Value Share (%) and BPS Analysis by Application, 2023 to 2033
Figure 68: Latin America Market Y-o-Y Growth (%) Projections by Application, 2023 to 2033
Figure 69: Latin America Market Attractiveness by Size, 2023 to 2033
Figure 70: Latin America Market Attractiveness by Packaging Type, 2023 to 2033
Figure 71: Latin America Market Attractiveness by Application, 2023 to 2033
Figure 72: Latin America Market Attractiveness by Country, 2023 to 2033
Figure 73: Western Europe Market Value (US$ Million) by Size, 2023 to 2033
Figure 74: Western Europe Market Value (US$ Million) by Packaging Type, 2023 to 2033
Figure 75: Western Europe Market Value (US$ Million) by Application, 2023 to 2033
Figure 76: Western Europe Market Value (US$ Million) by Country, 2023 to 2033
Figure 77: Western Europe Market Value (US$ Million) Analysis by Country, 2018 to 2033
Figure 78: Western Europe Market Volume (Units) Analysis by Country, 2018 to 2033
Figure 79: Western Europe Market Value Share (%) and BPS Analysis by Country, 2023 to 2033
Figure 80: Western Europe Market Y-o-Y Growth (%) Projections by Country, 2023 to 2033
Figure 81: Western Europe Market Value (US$ Million) Analysis by Size, 2018 to 2033
Figure 82: Western Europe Market Volume (Units) Analysis by Size, 2018 to 2033
Figure 83: Western Europe Market Value Share (%) and BPS Analysis by Size, 2023 to 2033
Figure 84: Western Europe Market Y-o-Y Growth (%) Projections by Size, 2023 to 2033
Figure 85: Western Europe Market Value (US$ Million) Analysis by Packaging Type, 2018 to 2033
Figure 86: Western Europe Market Volume (Units) Analysis by Packaging Type, 2018 to 2033
Figure 87: Western Europe Market Value Share (%) and BPS Analysis by Packaging Type, 2023 to 2033
Figure 88: Western Europe Market Y-o-Y Growth (%) Projections by Packaging Type, 2023 to 2033
Figure 89: Western Europe Market Value (US$ Million) Analysis by Application, 2018 to 2033
Figure 90: Western Europe Market Volume (Units) Analysis by Application, 2018 to 2033
Figure 91: Western Europe Market Value Share (%) and BPS Analysis by Application, 2023 to 2033
Figure 92: Western Europe Market Y-o-Y Growth (%) Projections by Application, 2023 to 2033
Figure 93: Western Europe Market Attractiveness by Size, 2023 to 2033
Figure 94: Western Europe Market Attractiveness by Packaging Type, 2023 to 2033
Figure 95: Western Europe Market Attractiveness by Application, 2023 to 2033
Figure 96: Western Europe Market Attractiveness by Country, 2023 to 2033
Figure 97: Eastern Europe Market Value (US$ Million) by Size, 2023 to 2033
Figure 98: Eastern Europe Market Value (US$ Million) by Packaging Type, 2023 to 2033
Figure 99: Eastern Europe Market Value (US$ Million) by Application, 2023 to 2033
Figure 100: Eastern Europe Market Value (US$ Million) by Country, 2023 to 2033
Figure 101: Eastern Europe Market Value (US$ Million) Analysis by Country, 2018 to 2033
Figure 102: Eastern Europe Market Volume (Units) Analysis by Country, 2018 to 2033
Figure 103: Eastern Europe Market Value Share (%) and BPS Analysis by Country, 2023 to 2033
Figure 104: Eastern Europe Market Y-o-Y Growth (%) Projections by Country, 2023 to 2033
Figure 105: Eastern Europe Market Value (US$ Million) Analysis by Size, 2018 to 2033
Figure 106: Eastern Europe Market Volume (Units) Analysis by Size, 2018 to 2033
Figure 107: Eastern Europe Market Value Share (%) and BPS Analysis by Size, 2023 to 2033
Figure 108: Eastern Europe Market Y-o-Y Growth (%) Projections by Size, 2023 to 2033
Figure 109: Eastern Europe Market Value (US$ Million) Analysis by Packaging Type, 2018 to 2033
Figure 110: Eastern Europe Market Volume (Units) Analysis by Packaging Type, 2018 to 2033
Figure 111: Eastern Europe Market Value Share (%) and BPS Analysis by Packaging Type, 2023 to 2033
Figure 112: Eastern Europe Market Y-o-Y Growth (%) Projections by Packaging Type, 2023 to 2033
Figure 113: Eastern Europe Market Value (US$ Million) Analysis by Application, 2018 to 2033
Figure 114: Eastern Europe Market Volume (Units) Analysis by Application, 2018 to 2033
Figure 115: Eastern Europe Market Value Share (%) and BPS Analysis by Application, 2023 to 2033
Figure 116: Eastern Europe Market Y-o-Y Growth (%) Projections by Application, 2023 to 2033
Figure 117: Eastern Europe Market Attractiveness by Size, 2023 to 2033
Figure 118: Eastern Europe Market Attractiveness by Packaging Type, 2023 to 2033
Figure 119: Eastern Europe Market Attractiveness by Application, 2023 to 2033
Figure 120: Eastern Europe Market Attractiveness by Country, 2023 to 2033
Figure 121: South Asia and Pacific Market Value (US$ Million) by Size, 2023 to 2033
Figure 122: South Asia and Pacific Market Value (US$ Million) by Packaging Type, 2023 to 2033
Figure 123: South Asia and Pacific Market Value (US$ Million) by Application, 2023 to 2033
Figure 124: South Asia and Pacific Market Value (US$ Million) by Country, 2023 to 2033
Figure 125: South Asia and Pacific Market Value (US$ Million) Analysis by Country, 2018 to 2033
Figure 126: South Asia and Pacific Market Volume (Units) Analysis by Country, 2018 to 2033
Figure 127: South Asia and Pacific Market Value Share (%) and BPS Analysis by Country, 2023 to 2033
Figure 128: South Asia and Pacific Market Y-o-Y Growth (%) Projections by Country, 2023 to 2033
Figure 129: South Asia and Pacific Market Value (US$ Million) Analysis by Size, 2018 to 2033
Figure 130: South Asia and Pacific Market Volume (Units) Analysis by Size, 2018 to 2033
Figure 131: South Asia and Pacific Market Value Share (%) and BPS Analysis by Size, 2023 to 2033
Figure 132: South Asia and Pacific Market Y-o-Y Growth (%) Projections by Size, 2023 to 2033
Figure 133: South Asia and Pacific Market Value (US$ Million) Analysis by Packaging Type, 2018 to 2033
Figure 134: South Asia and Pacific Market Volume (Units) Analysis by Packaging Type, 2018 to 2033
Figure 135: South Asia and Pacific Market Value Share (%) and BPS Analysis by Packaging Type, 2023 to 2033
Figure 136: South Asia and Pacific Market Y-o-Y Growth (%) Projections by Packaging Type, 2023 to 2033
Figure 137: South Asia and Pacific Market Value (US$ Million) Analysis by Application, 2018 to 2033
Figure 138: South Asia and Pacific Market Volume (Units) Analysis by Application, 2018 to 2033
Figure 139: South Asia and Pacific Market Value Share (%) and BPS Analysis by Application, 2023 to 2033
Figure 140: South Asia and Pacific Market Y-o-Y Growth (%) Projections by Application, 2023 to 2033
Figure 141: South Asia and Pacific Market Attractiveness by Size, 2023 to 2033
Figure 142: South Asia and Pacific Market Attractiveness by Packaging Type, 2023 to 2033
Figure 143: South Asia and Pacific Market Attractiveness by Application, 2023 to 2033
Figure 144: South Asia and Pacific Market Attractiveness by Country, 2023 to 2033
Figure 145: East Asia Market Value (US$ Million) by Size, 2023 to 2033
Figure 146: East Asia Market Value (US$ Million) by Packaging Type, 2023 to 2033
Figure 147: East Asia Market Value (US$ Million) by Application, 2023 to 2033
Figure 148: East Asia Market Value (US$ Million) by Country, 2023 to 2033
Figure 149: East Asia Market Value (US$ Million) Analysis by Country, 2018 to 2033
Figure 150: East Asia Market Volume (Units) Analysis by Country, 2018 to 2033
Figure 151: East Asia Market Value Share (%) and BPS Analysis by Country, 2023 to 2033
Figure 152: East Asia Market Y-o-Y Growth (%) Projections by Country, 2023 to 2033
Figure 153: East Asia Market Value (US$ Million) Analysis by Size, 2018 to 2033
Figure 154: East Asia Market Volume (Units) Analysis by Size, 2018 to 2033
Figure 155: East Asia Market Value Share (%) and BPS Analysis by Size, 2023 to 2033
Figure 156: East Asia Market Y-o-Y Growth (%) Projections by Size, 2023 to 2033
Figure 157: East Asia Market Value (US$ Million) Analysis by Packaging Type, 2018 to 2033
Figure 158: East Asia Market Volume (Units) Analysis by Packaging Type, 2018 to 2033
Figure 159: East Asia Market Value Share (%) and BPS Analysis by Packaging Type, 2023 to 2033
Figure 160: East Asia Market Y-o-Y Growth (%) Projections by Packaging Type, 2023 to 2033
Figure 161: East Asia Market Value (US$ Million) Analysis by Application, 2018 to 2033
Figure 162: East Asia Market Volume (Units) Analysis by Application, 2018 to 2033
Figure 163: East Asia Market Value Share (%) and BPS Analysis by Application, 2023 to 2033
Figure 164: East Asia Market Y-o-Y Growth (%) Projections by Application, 2023 to 2033
Figure 165: East Asia Market Attractiveness by Size, 2023 to 2033
Figure 166: East Asia Market Attractiveness by Packaging Type, 2023 to 2033
Figure 167: East Asia Market Attractiveness by Application, 2023 to 2033
Figure 168: East Asia Market Attractiveness by Country, 2023 to 2033
Figure 169: Middle East and Africa Market Value (US$ Million) by Size, 2023 to 2033
Figure 170: Middle East and Africa Market Value (US$ Million) by Packaging Type, 2023 to 2033
Figure 171: Middle East and Africa Market Value (US$ Million) by Application, 2023 to 2033
Figure 172: Middle East and Africa Market Value (US$ Million) by Country, 2023 to 2033
Figure 173: Middle East and Africa Market Value (US$ Million) Analysis by Country, 2018 to 2033
Figure 174: Middle East and Africa Market Volume (Units) Analysis by Country, 2018 to 2033
Figure 175: Middle East and Africa Market Value Share (%) and BPS Analysis by Country, 2023 to 2033
Figure 176: Middle East and Africa Market Y-o-Y Growth (%) Projections by Country, 2023 to 2033
Figure 177: Middle East and Africa Market Value (US$ Million) Analysis by Size, 2018 to 2033
Figure 178: Middle East and Africa Market Volume (Units) Analysis by Size, 2018 to 2033
Figure 179: Middle East and Africa Market Value Share (%) and BPS Analysis by Size, 2023 to 2033
Figure 180: Middle East and Africa Market Y-o-Y Growth (%) Projections by Size, 2023 to 2033
Figure 181: Middle East and Africa Market Value (US$ Million) Analysis by Packaging Type, 2018 to 2033
Figure 182: Middle East and Africa Market Volume (Units) Analysis by Packaging Type, 2018 to 2033
Figure 183: Middle East and Africa Market Value Share (%) and BPS Analysis by Packaging Type, 2023 to 2033
Figure 184: Middle East and Africa Market Y-o-Y Growth (%) Projections by Packaging Type, 2023 to 2033
Figure 185: Middle East and Africa Market Value (US$ Million) Analysis by Application, 2018 to 2033
Figure 186: Middle East and Africa Market Volume (Units) Analysis by Application, 2018 to 2033
Figure 187: Middle East and Africa Market Value Share (%) and BPS Analysis by Application, 2023 to 2033
Figure 188: Middle East and Africa Market Y-o-Y Growth (%) Projections by Application, 2023 to 2033
Figure 189: Middle East and Africa Market Attractiveness by Size, 2023 to 2033
Figure 190: Middle East and Africa Market Attractiveness by Packaging Type, 2023 to 2033
Figure 191: Middle East and Africa Market Attractiveness by Application, 2023 to 2033
Figure 192: Middle East and Africa Market Attractiveness by Country, 2023 to 2033
The market is valued at USD 2.68 billion in 2023.
The growth potential of the 2 loop FIBC bags market is 3% CAGR through 2033.
Booming e-commerce, e-retail sectors, and enhanced manufacturing technologies are expected to drive market growth.
Bottles segment is likely to remain highly preferred through 2033.
Greif, Chuangda Group, and Rockleigh Industries are key market players.
Explore Similar Insights
Thank you!
You will receive an email from our Business Development Manager. Please be sure to check your SPAM/JUNK folder too.