The HR tech market is experiencing robust growth. Increasing digital transformation across enterprises, rising adoption of cloud-based solutions, and the need for efficient workforce management systems are driving market expansion. Current dynamics are being influenced by automation in recruitment, performance management, and employee engagement processes.
Organizations are increasingly investing in data-driven platforms to enhance decision-making and streamline HR operations. The market outlook remains positive, supported by the growing focus on hybrid workforce models, employee well-being initiatives, and compliance with evolving labor regulations. Vendors are integrating artificial intelligence, analytics, and automation into their platforms to deliver predictive insights and improve user experience.
Growth rationale is centered on the shift toward integrated, scalable HR solutions that reduce administrative complexity and optimize productivity With increasing enterprise digitization and a global emphasis on talent retention and workforce analytics, the HR tech market is poised for sustained expansion and innovation-led competitiveness in the coming years.

| Metric | Value |
|---|---|
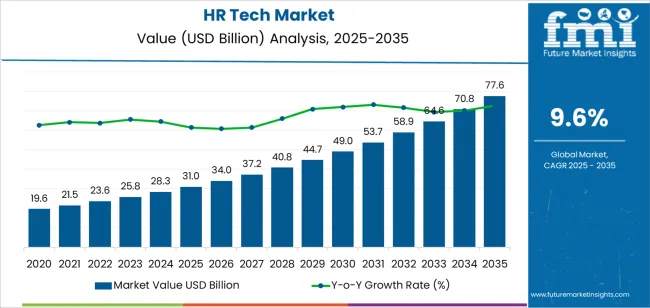
| HR Tech Market Estimated Value in (2025 E) | USD 31.0 billion |
| HR Tech Market Forecast Value in (2035 F) | USD 77.6 billion |
| Forecast CAGR (2025 to 2035) | 9.6% |
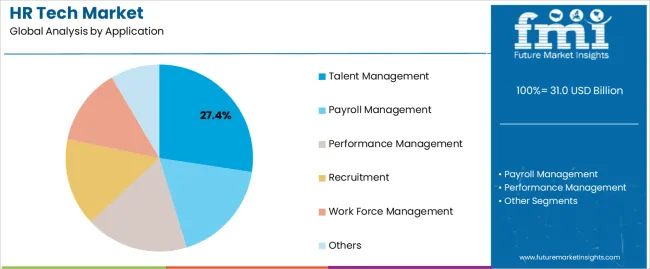
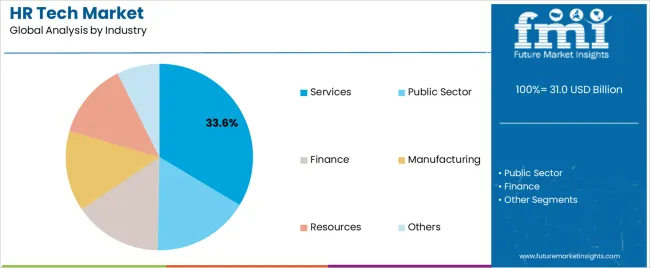
The market is segmented by Application and Industry and region. By Application, the market is divided into Talent Management, Payroll Management, Performance Management, Recruitment, Work Force Management, and Others. In terms of Industry, the market is classified into Services, Public Sector, Finance, Manufacturing, Resources, and Others. Regionally, the market is classified into North America, Latin America, Western Europe, Eastern Europe, Balkan & Baltic Countries, Russia & Belarus, Central Asia, East Asia, South Asia & Pacific, and the Middle East & Africa.

The talent management segment, accounting for 27.40% of the application category, has been leading the market due to the growing emphasis on optimizing workforce potential and improving employee lifecycle management. Adoption has been driven by organizations seeking to enhance recruitment efficiency, performance tracking, and learning development.
Integration of AI-based analytics and cloud deployment has improved process automation and decision-making accuracy. The segment’s strong position has been reinforced by its ability to align employee goals with organizational strategy, improving engagement and retention.
Demand has also been sustained by the adoption of scalable, customizable platforms that cater to diverse enterprise requirements Continuous innovation in predictive analytics and personalized development modules is expected to maintain the segment’s dominance and further strengthen its value proposition in strategic HR management.

The services industry segment, representing 33.60% of the industry category, has remained dominant owing to the high volume of workforce management activities across consulting, IT, and professional service firms. The need for efficient recruitment, onboarding, and payroll systems in labor-intensive sectors has accelerated adoption.
Cloud-based HR platforms have enabled service providers to manage distributed teams and remote workforces more effectively. The segment benefits from the constant demand for scalability, compliance assurance, and cost efficiency.
Integration of digital onboarding, performance analytics, and employee experience solutions has further enhanced operational agility With continuous growth in outsourcing and flexible staffing models, the services segment is expected to sustain its leadership, driving further expansion of HR technology implementation across global enterprises.
| Historical CAGR (2020 to 2025) | 7.4% |
|---|---|
| Forecast CAGR (2025 to 2035) | 9.6% |
The increase in forecasted CAGR from 7.4% to 9.6% reflects a positive outlook for the HR tech market, driven by technological innovation, shifting workplace dynamics, and evolving organizational needs.
Several factors are anticipated to drive this accelerated growth rate in the future:
Companies are prioritizing diversity, equity, and inclusion initiatives, driving the demand for HR tech solutions that facilitate DEI analytics, bias detection in recruitment processes, and inclusive learning and development programs to foster a more inclusive workplace culture.
With increased scrutiny on data privacy regulations, HR tech vendors prioritize data protection and security features to ensure compliance with global privacy laws such as GDPR and CCPA, safeguard sensitive employee information, and mitigate risks of data breaches.
As the gig economy continues to expand, HR tech platforms are adapting to accommodate freelance, contract, and contingent workers by offering workforce planning, onboarding, payment processing, and performance management solutions tailored to non-traditional employment arrangements.
Organizations are leveraging HR analytics and predictive insights derived from big data to drive strategic decision-making in areas such as talent acquisition, succession planning, workforce planning, and performance management, leading to more data-driven HR practices.
This section provides detailed insights into specific segments in the HR tech industry.
| Leading Application Segment | Recruitment |
|---|---|
| Market Share in 2025 | 24.2% |
Recruitment software remains the undisputed leader in the HR tech industry, maintaining a share of 24.2% in 2025.
| Dominating Industry | Public Sector |
|---|---|
| Market Share in 2025 | 17.4% |
The public sector is expected to witness a significant upsurge in HR tech adoption, with a projected market share of 17.4% in 2025.
The section analyzes the HR tech market across key countries, including the United States, Australia, China, Japan, and Germany. The analysis delves into the specific factors driving the demand for HR tech in these countries.
| Countries | CAGR |
|---|---|
| United States | 6.4% |
| Australia | 13.1% |
| China | 10.1% |
| Japan | 4.3% |
| Germany | 5.0% |
The United States HR tech industry, with a mature and established market, is projected to maintain a steady growth trajectory at a CAGR of 6.4% through 2035.
Australia's HR tech industry is poised for significant growth, with a projected CAGR of 13.1% through 2035.
China's HR tech industry is expected to experience rapid growth at a CAGR of 10.1% through 2035, fueled by several key drivers:
Japan's HR tech industry is expected to experience a steady CAGR of 4.3% through 2035.
Germany's HR tech market is expected to rise at a healthy CAGR of 5.0% through 2035.

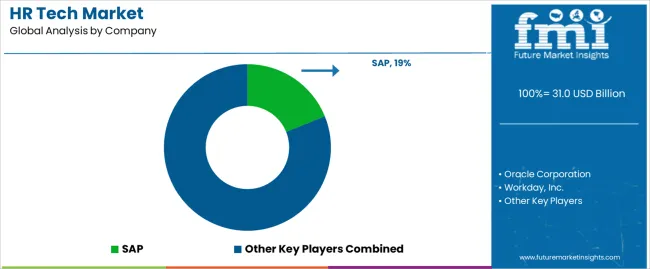
The competitive outlook of the HR Tech industry is shaped by innovation, market consolidation, and shifting customer demands. Established players like Oracle Corporation and Workday, Inc. are offering comprehensive HR Tech suites encompassing recruitment, talent management, payroll, and analytics solutions.
These industry giants leverage their extensive resources, technological expertise, and global presence to maintain market leadership and expand their product offerings through continuous research and development initiatives.
In addition to established players, the HR Tech industry also features a diverse ecosystem of emerging startups and niche providers specializing in specific HR functions or catering to niche markets. These agile competitors often introduce disruptive technologies and innovative solutions that challenge incumbents and drive industry innovation.
Startups benefit from the growing demand for specialized HR Tech solutions, particularly in areas such as employee engagement, wellness, diversity, equity, and inclusion (DEI), where they can carve out a competitive advantage by addressing specific pain points or unmet needs in the market.
Recent Developments in the HR Tech Industry
The global hr tech market is estimated to be valued at USD 31.0 billion in 2025.
The market size for the hr tech market is projected to reach USD 77.6 billion by 2035.
The hr tech market is expected to grow at a 9.6% CAGR between 2025 and 2035.
The key product types in hr tech market are talent management, payroll management, performance management, recruitment, work force management and others.
In terms of industry, services segment to command 33.6% share in the hr tech market in 2025.


Full Research Suite comprises of:
Market outlook & trends analysis
Interviews & case studies
Strategic recommendations
Vendor profiles & capabilities analysis
5-year forecasts
8 regions and 60+ country-level data splits
Market segment data splits
12 months of continuous data updates
DELIVERED AS:
PDF EXCEL ONLINE
HR Tech Consulting Market - Forecast through 2034
HR Analytics Market
Threat Intelligence Market Size and Share Forecast Outlook 2025 to 2035
Shrink Wrapping Machines Market Size and Share Forecast Outlook 2025 to 2035
Shrink Wrapper Market Size and Share Forecast Outlook 2025 to 2035
Chromatography Resin Market Forecast and Outlook 2025 to 2035
Chromium Zirconium Copper Rod Market Size and Share Forecast Outlook 2025 to 2035
Chronic Sarcoidosis Therapeutics Market Size and Share Forecast Outlook 2025 to 2035
Christmas Tree Valve Market Size and Share Forecast Outlook 2025 to 2035
Chromatography Instrumentation Market Size and Share Forecast Outlook 2025 to 2035
Three Wheeled Motorcycle Market Size and Share Forecast Outlook 2025 to 2035
Chronotherapy Market Size and Share Forecast Outlook 2025 to 2035
Shrink Sleeve Label Applicator Market Size and Share Forecast Outlook 2025 to 2035
Chronic Phase Markers Market Size and Share Forecast Outlook 2025 to 2035
Chromium Polynicotinate Market Size and Share Forecast Outlook 2025 to 2035
Chronic Venous Occlusions Treatment Market Size and Share Forecast Outlook 2025 to 2035
Chromatin Immunoprecipitation Sequencing Market Size and Share Forecast Outlook 2025 to 2035
Chromium Trioxide Market Size and Share Forecast Outlook 2025 to 2035
Chromatin Immunoprecipitation Testing Market Size and Share Forecast Outlook 2025 to 2035
Through-Type Shelves Market Size and Share Forecast Outlook 2025 to 2035

Thank you!
You will receive an email from our Business Development Manager. Please be sure to check your SPAM/JUNK folder too.
Chat With
MaRIA